Introduction
Nobody likes a slow website. Slow load times lead to reduced engagement, higher bounce rates, and lower search engine rankings. In essence, a slow website means less business.
And that’s the reason I put together this guide. By following all the tips and actionable advice I outlined in this guide, you’ll be able to improve your Framer website’s load times, reduce bounce rates, and improve the overall user experience.
In other words, your website will make you more money from the same amount of traffic!
So, whether you’re a website owner or a Framer developer, this is a must-read for taking your site performance to the next level.
More specifically, I’ll go over:
How to measure your website performance
Understanding Core Web Vitals (made simple)
Framer’s built-in optimisation features
10 (native) ways to speed up your Framer website
FAQs
Ready to improve your site’s performance? Let’s get started!
How to measure your website performance
The internet is full of website performance testing tools you can use. However, nothing is more accurate than what real people are experiencing on your website.
How do you get those data? Simple, by looking at your web core vitals.
If you’re unfamiliar with the term, your core web vitals are a set of metrics that measure real-world user experience for loading speed, interactivity, and visual stability of the page.
Google also uses core web vitals as a ranking factor as they are tightly correlated with the overall user experience of your website.
There are three main ways you can use to view your core web vitals:
Using Google Search Console
→ If you’re the website owner, you can use GSC to look directly at your core web vitals (alongside other important metrics).
Using PageSpeed Insights
→ Even if you’re not the owner, you can check core web vitals by running a simple PageSpeed Insights analysis.
CrUX Dashboard
→ Lastly, you can use the official CrUX dashboard to get a complete overview of any site's Core Web Vitals (even if you are not the owner)
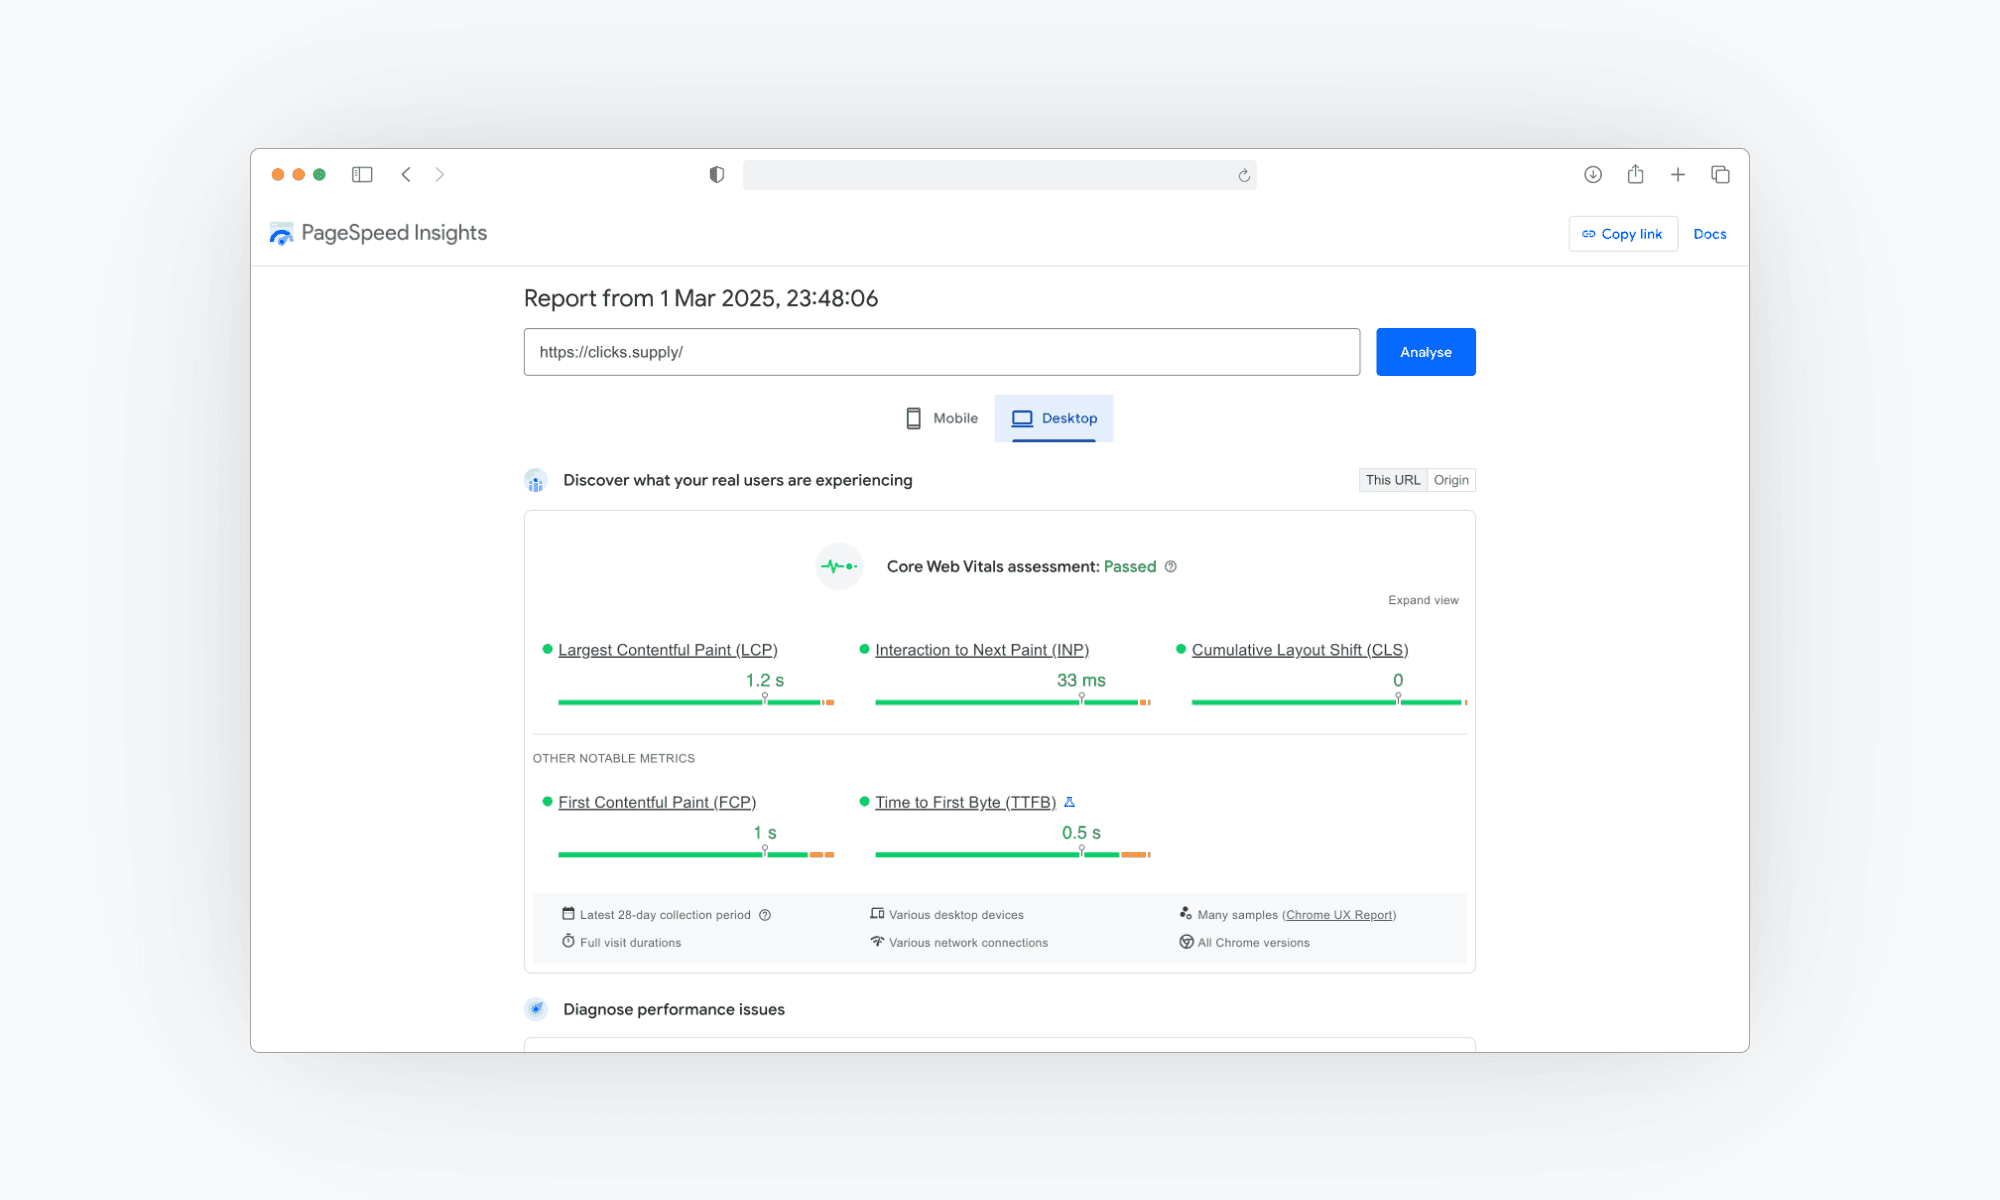
For instance, here’s a screenshot of my core web vitals measured using PageSpeed Insights:
Understanding Core Web Vitals (made simple)
As you can see from the image above, there are six metrics that currently make up the web vitals report. Let’s quickly go over each one of them:
Largest Contentful Paint (LCP)
→ LCP measures the time it takes for a page’s main content to load. Ideally, this metric should be below 2.5 seconds.
Interaction to Next Paint (INP)
→ Measures a page’s overall responsiveness to user interaction (the time it takes for the page to respond to a user clicking something). An INP below 0.2 seconds is considered very good.
Cumulative Layout Shift (CLS)
→ This metric measures visual stability. Ideally, it should be less than 0.1s
First Input Delay (FID)
→ The time it takes for a page to become interactive. An ideal measurement is less than or equal to 100 ms. (Google replaced FID with INP for CWV in March 2024).
First Contentful Paint (FCP)
→ FCP measures the time it takes for a user to see any visible content on a web page after they navigate to it. Ideally, FCP shouldn’t take longer than 1.8 seconds.
Time to First Byte (TTFB)
→ TTFB measures the time it takes for a browser to receive the first byte of content from a server after making a request. A good TTFB should be under 0.8 seconds.
Of the six web vitals I’ve listed above, only the first three are part of the “core web vitals”. However, all of them are important for a good user experience and are also tightly interrelated.
For example, the Largest Contentful Paint is highly dependent on First Contentful Paint (FCP) and Time to First Byte (TTFB).
That’s why monitoring and improving all of these metrics is critical to providing the best user experience possible.

A couple of notes about Core Web Vitals
Before we start, there are two important things you need to know about core web vitals:
Core Web Vitals are different from mobile to desktop.
Core Web Vitals are measured in groups of URLs.
Let’s start with the first one: Just because you pass the core web vitals for desktop devices doesn’t necessarily mean you’ll pass those for mobile devices. Always make sure your website loads fast regardless of the device it’s viewed on.
The second point is a bit more technical, but I’ll try to make it as easy as possible. Your core web vitals are measured for groups of URLs, not single ones.
These groups are created when URLs within your domain have similar core web vitals.
For example, my “normal” pages are measured in a different group than my blog pages because they tend to be faster. Why? Because they have much less content and fewer images to load.
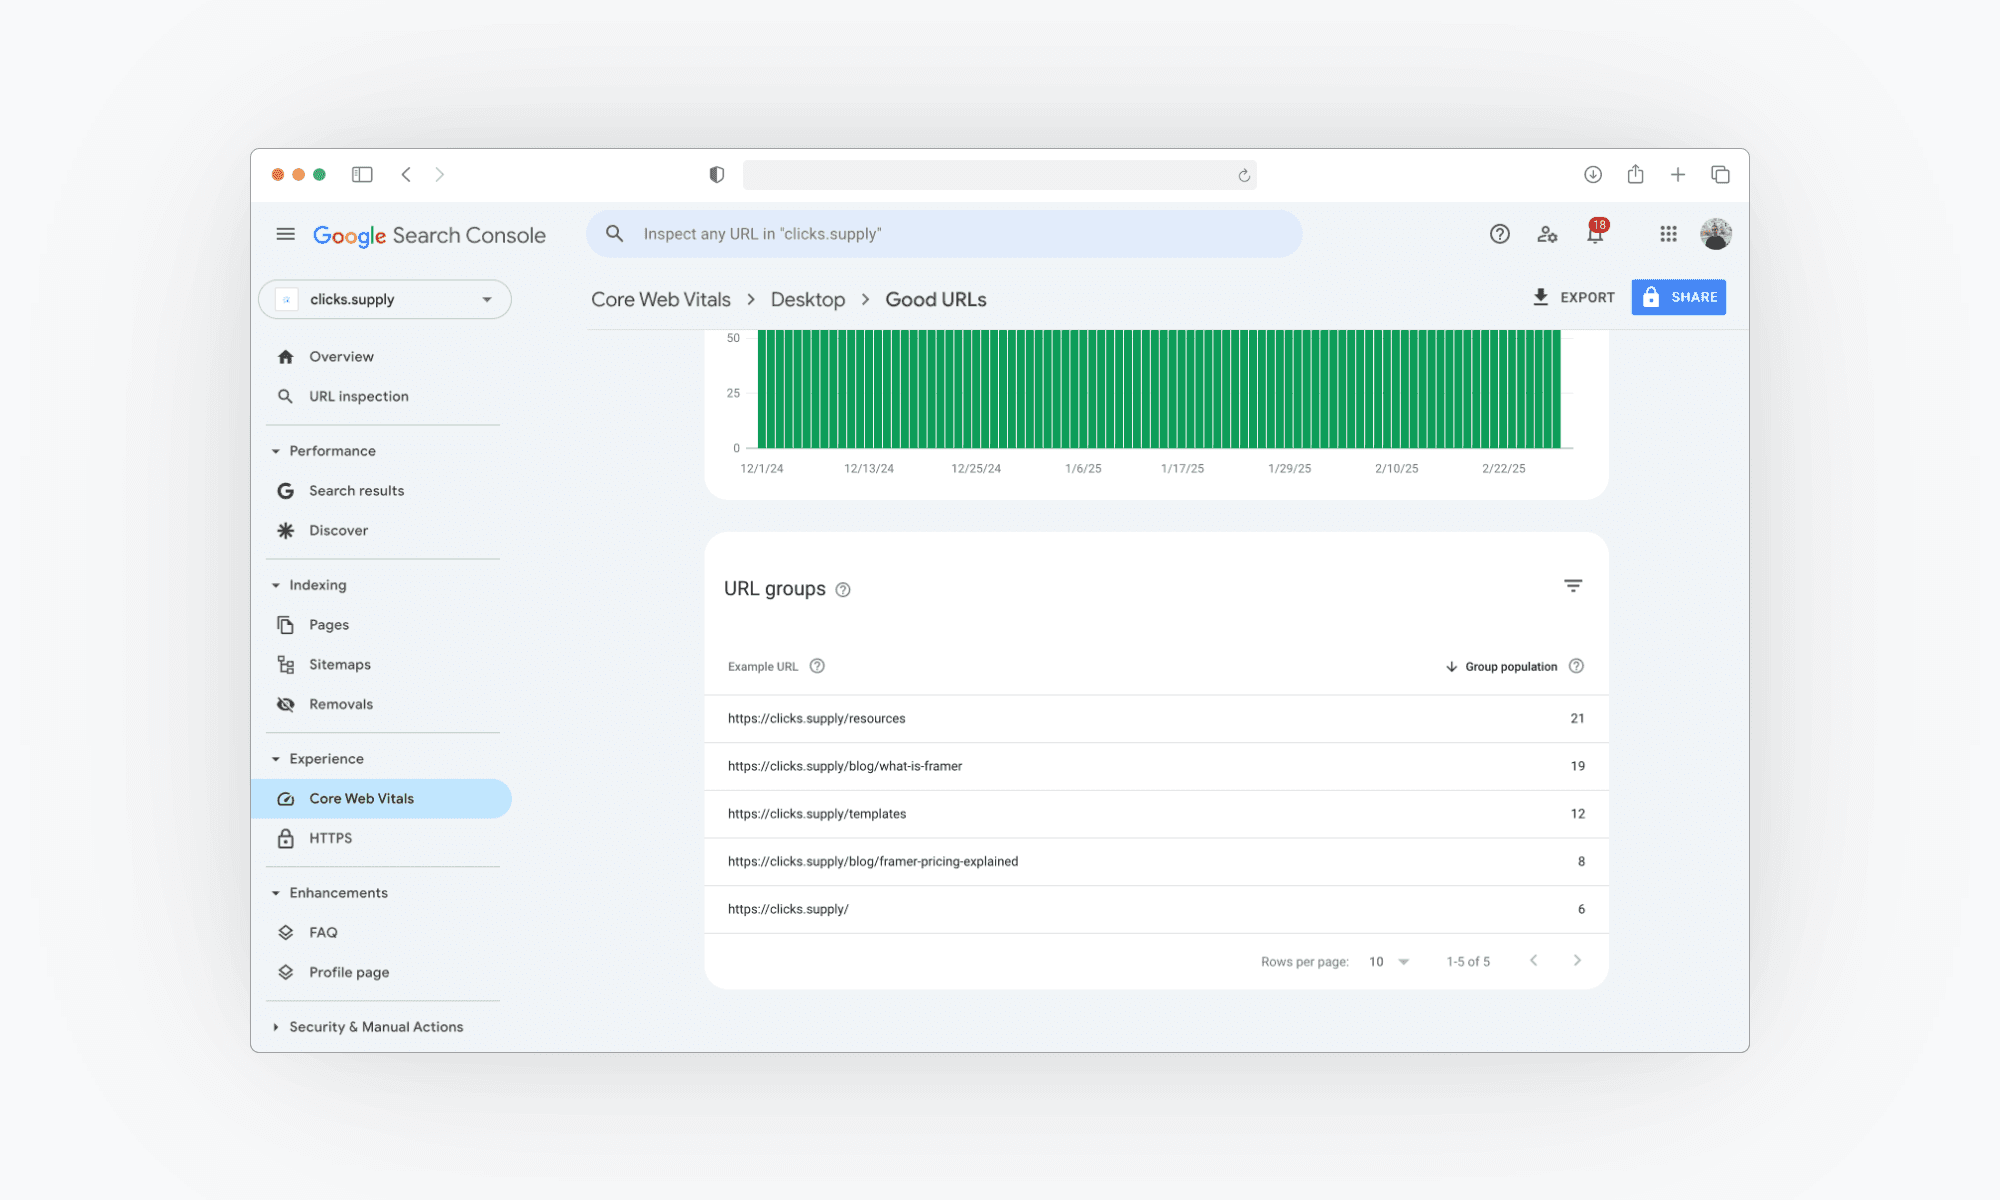
Despite how URLs are organised, it’s essential to make sure that every group performs well.
Now that we understand the basics, let’s look at what Framer does for us.
Framer’s built-in optimisation features
Before we start with the guide, I want to briefly mention that Framer does a lot under the hood to make their sites lightning-fast without much effort on your side.
It’s impossible to go over everything as a lot happens under the hood (big prop to the engineering team), but here are a few important updates and notions to keep in mind:
Framer sites are actually Single-Page React Applications (SPA). Framer’s reliance of React has many positive effects on both performance and UX, here’s an interesting deep dive on the reasons behind Framer’s choice.
Framer automatically optimises images, videos, and fonts (more on images and videos later).
The performance engineering team is always working to improve the loading speed of Framer sites, and you can follow all their most important updates here.
Enough with the theory; let’s get to the tips!
10 (native) ways to speed up your Framer website
Tip 1: ensure the project is optimised
Impact: High 🚀🚀🚀
Effort: Low 🙂 🙂🙂
Ensuring your project is optimised is probably the most important thing you can do on this list. When you first deploy a Framer site, Framer will create a simple, fully client-rendered HTML file (this ties back to Framer using React).
This is great for the user (you 🫵🏻) as it allows you to publish the site instantly and see the changes live immediately.
However, this is sub-optimal for performance, so Framer starts optimising the project in the backend. There are a couple of things that happen during this process:
Server-Side Rendering (SSR)
→ Instead of serving a blank HTML page and adding all the content via JavaScript, Framer will generate a pre-rendered version of the page that will be served once the site is optimised.
→ This is great for performance because a ready-made page is much quicker to load than one that relies exclusively on JS to load all the content. (it’s also great for SEO, as search engines have a much harder time dealing with client-side rendering compared to SSR)
Scripts optimisation
→ All the JavaScript files used to make your Framer site function are optimised under the hood during this process to make them as efficient and lightweight as possible.
Once the optimisation process finishes, the empty HTML file will be substituted with the new server-side rendered version of the page.
If the optimisation process fails, Framer will keep serving the empty HTML file, which will seriously negatively impact both performance and SEO (for the reasons mentioned above).
A project can fail to optimise for two main reasons:
You have invalid HTML on your site (e.g. nested links)
One or more of your custom code components are crashing on the server
To fix the former, you just have to find and remove the invalid HTML. The most common case is nested links, so I created a video to help you quickly debug it, which you can find here.
Fixing the second is slightly more tricky, as it really depends on how your code is structured. In general, you want to keep everything that manipulates the Window or Document object inside the useEffect() hook, as this will ensure that the piece of code only runs on the client (browser).

Tip 2: images & SVGs
Impact: Medium 🚀🚀
Effort: Low 🙂 🙂🙂
As mentioned in the previous section, Framer already does the heavy lifting in optimising images by compressing and converting them to AVIF, serving resized versions based on the viewport size, and also lazy loading most of the images below the fold.
That said, you can still follow a couple of best practices to ensure you get the most out of the optimisation process.
To be specific, here’s what you can do:
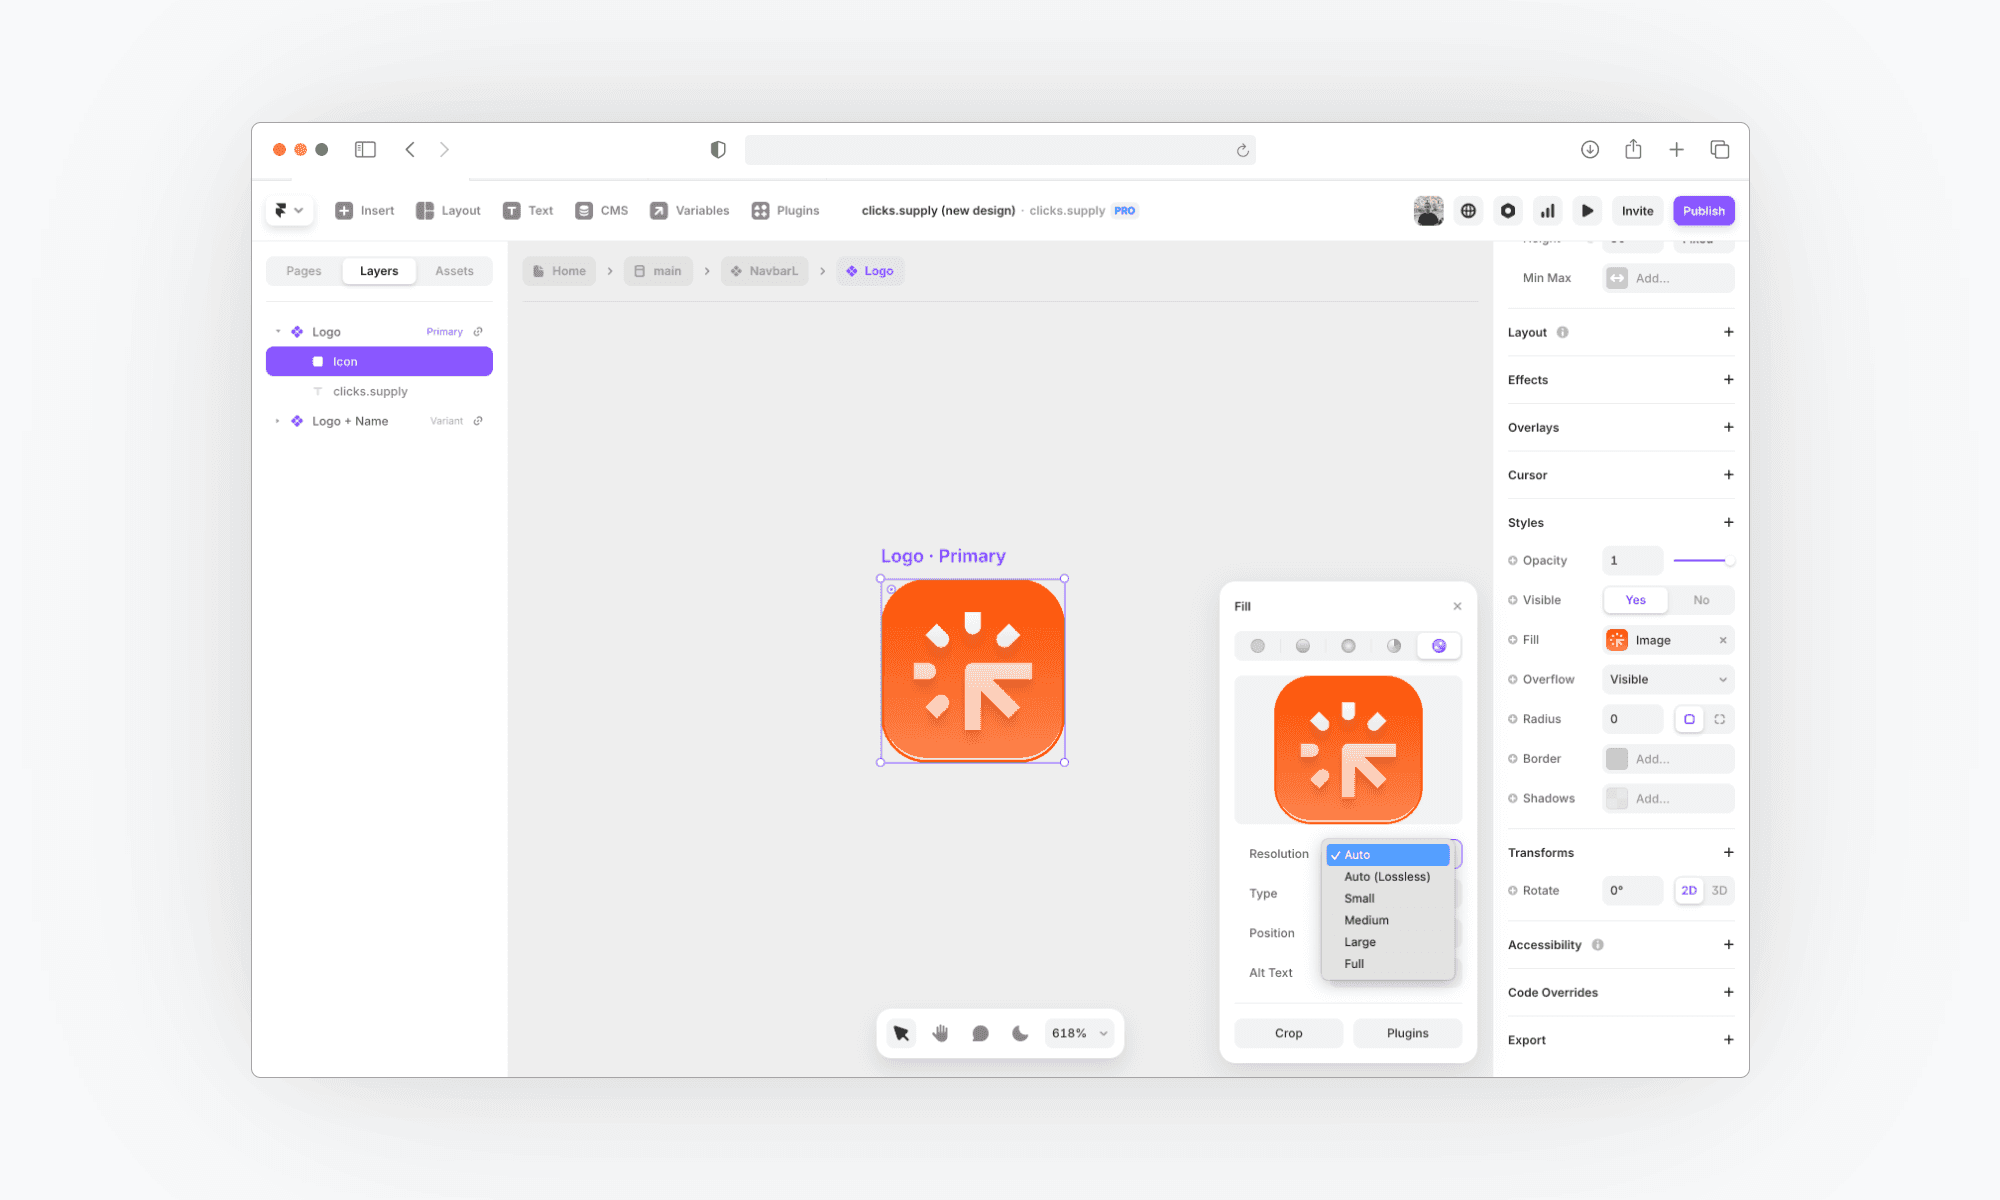
Resolution
→ Wherever possible, set the image resolution you are uploading to “Auto.” This ensures the processes I mentioned above happen, leading to the best performances possible.
→ While this will work in 99% of cases, there may be some cases where the compression is slightly too noticeable; in these cases, you want to play around with the six available resolution options until you are satisfied with the results. Remember that as you go lower on the list (small, medium, large, and full), the image will become heavier and heavier, impacting loading speed.
SVGs
→ When using SVGs, upload them as you would with a normal image (frame → fill → image), rather than dragging and dropping it inside the canvas.
These two best practices alone will ensure assets like images and graphics don’t slow down your site more than necessary.
Tip 3: videos
Impact: High 🚀🚀🚀
Effort: Medium 🙂 🙂
Videos are intrinsically way heavier than images. Unfortunately, Framer doesn’t optimise them in any way (except for some lazy loading).
There are two main solutions for this:
Embed the video using YouTube or Vimeo (best)
Compress the video yourself
Both YouTube and Vimeo have sophisticated infrastructures that allow them to serve videos in the most efficient way possible.
If that’s not an option for you, consider optimising your videos with a free tool like veed.io.
Another thing to keep in mind, especially when you have a video above the fold, is to always provide a cover for it as the cover is much quicker to load compared to the first frame of the video.
Tip 4: beware of elements that run on JavaScript
Impact: Medium 🚀🚀
Effort: Medium 🙂 🙂
There are a few elements in Framer that need to run on JavaScript. This can be problematic because things shown using JavaScript will appear much later compared to elements that don’t need it, as the latter will be pre-rendered while the former will need to be added to the page by the browser.
Some of these elements include:
The cookie banner
The slideshow, carousel, and ticker component
Text that uses text effects
Elements that use scroll animations
While there’s nothing inherently wrong with using these elements, if one of these gets picked as the LCP element, it will greatly impact your Core Web Vitals report.
In general, you want to avoid using JS-based elements when they can get picked as the LCP element. This means:
Avoid having very large chunks of text in the cookie banner (if you need a lot of text, simply break it down into multiple paragraphs)
Avoid using big slideshows, carousels, and tickers above the fold.
Avoid applying text effects to the main heading of the page if that heading is an LCP candidate.
Avoid applying scroll animations to elements that are LCP candidates.
(you can test which element gets used as the LCP element by running your page through PageSpeed Insights and scrolling down to the “Largest Contentful Paint element” section, where you’ll see a picture highlighting the LCP element)

Tip 5: avoid large blurs and shadows
If your Framer site loads quickly but is super choppy while scrolling or running animations, you most likely have a problem with blurs and shadows.
Blurs and shadows do not directly impact loading speed (how long it takes you to see elements on the page), but severely impact how smooth scrolling and animations feel.
The solution here is very simple: Avoid using large blurs and big shadows. This doesn’t mean you should never use them, but be careful not to overuse them.
For example, if you want a blur in the background, you are much better off creating it in Figma and importing it as an image in Framer than drawing a frame and applying a huge blur.
Note: if you are interested in why this happens, here’s a short paragraph from the performance engineering team on the topic → link
Tip 6: reduce the DOM size
Impact: Medium 🚀🚀
Effort: High 🙂
DOM, or Document Object Model, essentially refers to the number of HTML tags on your page.
If you see an “Avoid an excessive DOM size” warning in Lighthouse, it might be worth considering doing some work on your site’s structure.
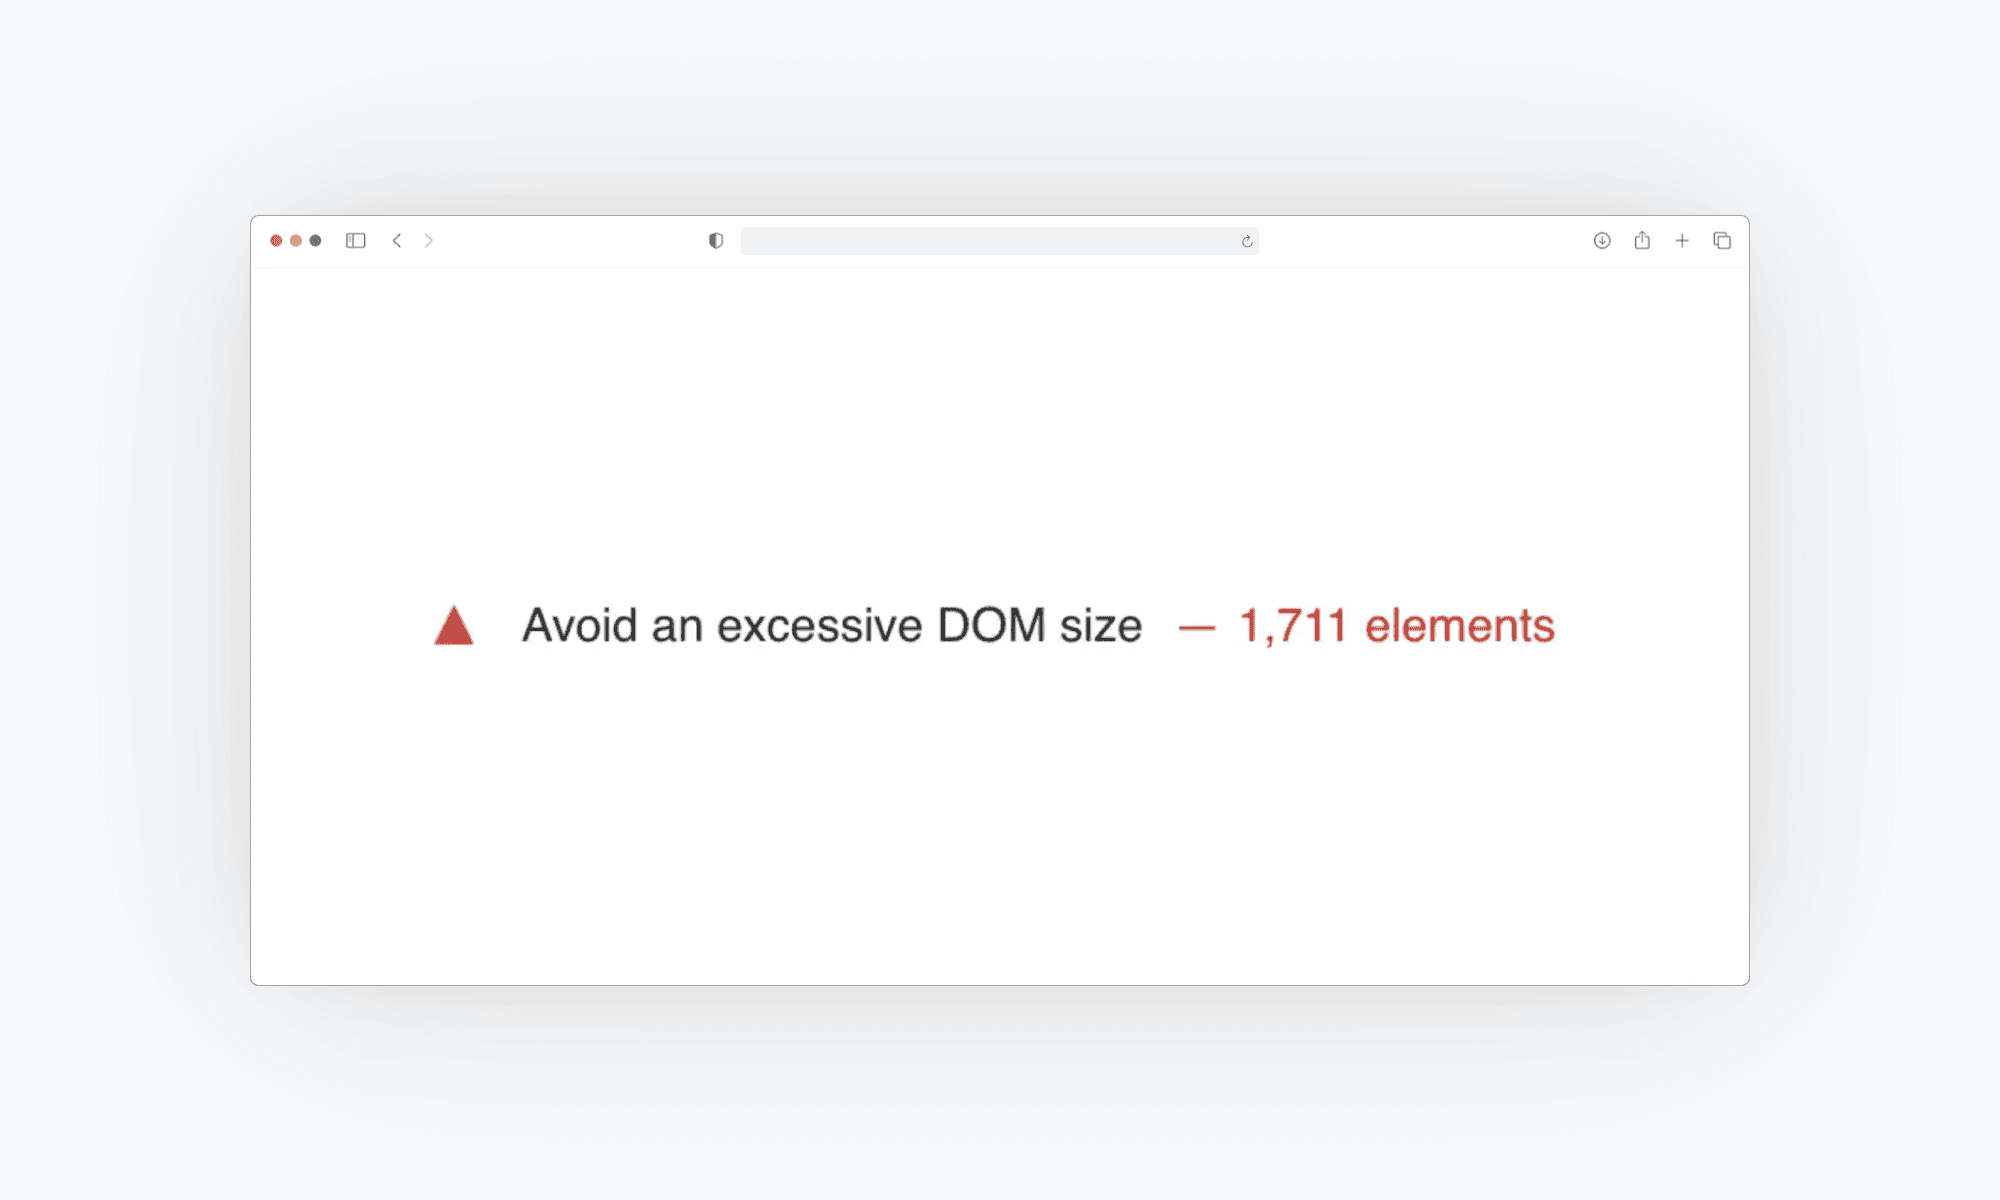
Lighthouse throws this warning in three cases:
Your page has a total of more than 1,500 nodes.
Your page has a maximum node depth greater than 32 nodes.
A parent node has more than 60 child nodes.
A large DOM tree can significantly slow down your website, so it’s important that you tackle this issue as soon as possible.
While I could write an entire article on this, here’s some simple guidelines you can follow:
The steps you need to take depend on what’s the cause of the problem:
Too many nodes (Problem 1):
→ If your page has too many nodes (problem 1), split it up into multiple pages. For instance, if your “about us” page is too long, consider dividing it into the following pages:
About the company
Our team
Our vision
Bad implementation (Problems 2 and 3):
→ The other two problems are likely caused by a bad website implementation. You should be able to spot them by looking at the left sidebar in your Framer project and searching for:
A series of elements that go too deep (a frame inside a frame inside a frame inside a frame…)
An element with too many sons (maybe a table with 60+ children)
Tip 7: beware of carousels, slideshows, and Ttckers
Impact: High 🚀🚀🚀
Effort: Low 🙂 🙂🙂
Carousels, slideshows, and tickers are all elements that can have a HUGE impact on your site speed.
Think about it. You’re loading a bunch of images that don’t even get displayed! They’re hidden in the background, waiting for the user to decide to view them.
If you care about performance but still want one, I would considering using it without too many elements and not in the hero section of the page (to avoid it being used as the LCP image for the page).

Tip 8: reduce third-party scripts
Impact: Medium 🚀🚀
Effort: Medium 🙂🙂
I don’t want to scare you. If you have one or two third-party scripts running on your website (e.g., Google Analytics and Meta Pixel), that’s probably not where you should focus your efforts.
However, if you have a ton of third-party scripts or they’re particularly heavy, that can significantly impact performances.
While the best-case scenario would be to remove them, I understand they might be necessary for you. So here are a couple of more advanced techniques you can try:
Technique 1: not all scripts need to run on all pages
If you’re only using a script on one page, there’s no need to make it load on the others.
Besides analytics and a couple of other exceptions, make sure you add the script only where it’s actually used.
Technique 2: use async or defer attributes
Use the async and defer attributes to control the loading order of third-party scripts.
Async tells the browser to load the script as soon as possible but allows other scripts and content to continue loading before it executes.
Defer, on the other hand, tells the browser to load the script in the background until all other scripts have finished loading, ensuring that the main content is rendered first.
However, please keep in mind that not all scripts can be deferred without any impact. For example, if you have an analytics tracking code and you defer it, you might save some loading time, but the accuracy of the data will take a big hit as they won’t be able to detect anything for the first few seconds.

Technique 3: consider embedding the script
If you’re working with a smaller piece of code to improve your site’s functionality, it’s better to use the embed component available in Framer.
While it might seem like the same thing, it’s not. If you embed the script, the browser doesn’t have to:
Establish the connection with the third party.
Download the script.
Drop the connection.
Tip 9: beware of complex animations
Impact: High 🚀🚀🚀
Effort: Low 🙂
Everybody loves fancy animations on a website - everybody except the browser.
This is because animations require the browser to recalculate the positions and visual styles of elements on the page multiple times per second.
The more animations you have (and the more complex they are), the harder the browser will have to work to make them function.
(This also ties back to tip 4, where I mentioned that some animations run on JavaScript and will appear much later than one would like.)
Tip 10: opt for a Google font
Impact: Low 🚀
Effort: Low 🙂
As with many other things on this list, Framer already does the heavy lifting by optimising your fonts.
But, If you want a little (and I underline “a little”) more speed, you might want to opt for a Google font rather than a custom font.
However, the rewards are minor, so it might not be worth the swap.

Test, test, and test
The most important advice I can give you is always to test whether your actions are making any difference.
If you think one of the steps outlined above will help you speed up your website, implement it and test it.
Do you suspect a part of your website is causing issues with your speed performance? Remove it and test it.
Always test before and after making any changes. This will ensure you’re not shooting in the dark. And do more than one test! Especially if you rely on a tool rather than real-world data.
While the best possible data you could ever get are core web vitals, I understand you might want a faster way to measure your results. If that’s the case, try one of the following tools:
(The good ol’) PageSpeed Insights
Webpagetest (most accurate)
Debugbear (especially useful for INP debugging)
FAQs
Q1: do PageSpeed Insights scores affect SEO?
No, PageSpeed Insights don’t affect your SEO. Your Core Web Vitals do.
Q2: why are my Core Web Vitals not available?
Core web vitals are only available after Google has gathered a good amount of data. If your website is new or doesn’t have enough traffic, your core web vitals report will not be available.
Q3: are Framer websites fast?
Yes, Framer websites can be fast. By combining Framer’s built-in optimisations with the techniques provided in this guide, you’ll have no problem making your site load quickly.
Conclusion
A slow website can be caused by a myriad of things. However, the problems outlined above are the most common and have the biggest impact on performance.
That being said, I want to thank you for taking the time to read the whole guide. I hope you’ve found it helpful.
If you want a done-for-you optimisation service for your Framer website, do not hesitate to reach out.
Thanks for reading!
- Luca

Luca Da Corte is a certified Framer Expert and Product Specialist at Framer, with over two years of experience helping teams build world-class websites. He’s also the founder of clicks.supply, one of the leading hubs for Framer templates, components, and resources.
Check other
Framer articles
Explore other articles, tutorials, and guides that will help you master Framer and use it to create stunning websites.


